investor
relations
chairman’s statement
The key development for the Company in 2023 was the increase in the % shareholding in M.K. Real Estate Development Plc. (“MK”) from 31.51% at end 2022 to 49.5%, completed in August. The additional investment established MK as the core investment within FNS Holdings Plc.(“FNS”). The decision to increase the stake in MK was based on the potential to create value in MK’s two principal businesses, the warehouse development business for lease under Prospect Development Co., Ltd. (“Prospect Development”) and the wellness business under RX Wellness Co., Ltd.(“RX Wellness”)
To finance the purchase of the additional stake in MK, FNS undertook a 1:1 Rights issue at par (THB 5) in July, which raised THB 772.1 million.
Increasing the stake in MK resulted in a material change in the presentation of the financial statements of FNS. From Q3 2023, FNS’ consolidated accounts included a full consolidation of the MK financials. This required the FNS consolidated Balance Sheet to reflect the consolidated equity value of MK and as this was higher than the total investment cost in MK, FNS recorded a one-off gain on consolidation of THB 674 million.
Other significant developments within the group in 2023 were (i) the sale of completed assets by Prospect Development worth THB 1.9 billion to the Prospect Logistics and Industrial Freehold and Leasehold REIT in Q1 (ii) the soft opening of a second wellness retreat, RXV Sampran in Q2 and (iii) the filing in Q3 2023 by NEO Corporate Plc. to list on the Stock Exchange of Thailand.
Other significant developments within the group in 2023 were (i) the sale of completed assets by Prospect Development worth THB 1.9 billion to the Prospect Logistics and Industrial Freehold and Leasehold REIT in Q1 (ii) the soft opening of a second wellness retreat, RXV Sampran in Q2 and (iii) the filing in Q3 2023 by NEO Corporate Plc. to list on the Stock Exchange of Thailand.
In terms of overall financial performance 2023, FNS recorded a consolidated net profit of THB 685 million for 2023 which compared with a net profit of THB 105 million recorded in 2022. As indicated earlier, the net profit in 2023 includes a one off gain of THB 674 million on the consolidation of MK. MK reported a Net Loss of THB 672 million for 2023 due primarily to the losses incurred by the wellness business within MK. The wellness losses reflected the opening of the second wellness retreat at Suan Sampran and the still early stage of development of this business.
Going forward, 2024 is expected to see significant developments at both the operating levels of the group companies and in the overall group structure, as management seeks to optimize asset allocation and capital utilisation across the group.
A key challenge for MK through 2023 and going into 2024 was the pressure on the credit rating of MK from the losses at RX Wellness and the prospect that these losses will continue through 2024 and 2025. This impacted Prospect Development to the extent that warehouse development is capital intensive and Prospect Development needs and benefits from optimal access to external loan financing. A proposal addressing this dilemma was presented to the shareholders of FNS and MK in February 2024 and passed. </span
Under the Restructuring Plan, FNS will acquire the operating business of RX Wellness and lease the associated wellness assets from MK. As part of the transaction, FNS will transfer all its warehouse-related interests to MK, comprising the investment in the units is PROSPECT REIT and the 50% interest in BFTZ Wangnoi. The Wellness business is early stage and FNS is better positioned to withstand the early stage losses of this business given the strength of its’ balance sheet in the light of the NEO listing. MK becomes an asset-based, income yielding, investment business with significant real estate assets. MK’s financial position will improve, as should its’ credit rating. This will benefit FNS given its’ 49.5% shareholding, and MK will no longer be dependent on FNS for financial support. FNS acquires a business with challenges in terms of losses in the short term, but significant long term potential.
In terms of operations, day to day, RX Wellness will become the focus of FNS management going forward. RX Wellness will be an asset light business, with limited capital expenditure, however there will need to be a significant growth in sales revenue to curtail losses. Losses are expected to be significant, but on a declining trend through 2024 and 2025. The key focus within RX Wellness in 2024 will be on sales and marketing and on increasing customers at both RAKxa Bangkrachao and RXV Sampran. FNS’ management believes that the wellness business has significant potential longer term and, for RAKxa, the potential to become an internationally recognized wellness brand with considerable value.
A key event for MK in 2024 is the planned sale of c.140,000 sqm. of completed warehousing by Prospect Development to the PROSPECT REIT in Q4 2024. MK management is also seeking further land sales as it continues its transition away from residential housing development towards business with higher quality and more sustainable earnings.
The IPO of NEO is now scheduled for late March 2024 and FNS will sell close to one third of its’ shareholding as part of the IPO. The balance will be sold in the secondary market, based on prevailing market conditions. This investment has been very successful and is expected to generate over THB 1.0 billion in cash for the Company.
With the group restructuring proposal now approved and being put into effect, management believes that the allocation of capital and operational focus of group companies are now clearer and more efficient, positioning the group well for long term, sustainable growth and creation of value
I would also like to take this opportunity to thank our shareholders for their supports in moving forward the restructuring proposal presented to them by the board of directors, and for their support in general.
read more>>
annual reports
form 56-1 reports
form 56-1
CIRCULAR NOTICE
annual summary
financials
| Consolidated Financial Statements | 2023 | 2022 | 2021 | 2020 | ||
| Revenues | ||||||
| Revenues from business operation | 203.2 | 88.6 | 43.7 | 552.0 | ||
| Revenues from sale of real estate | 566.8 | - | - | - | ||
| Revenues from rental and rendering of services | 230.1 | - | - | - | ||
| Revenues from management of real estate | 56.7 | - | - | - | ||
| Revenues from health and wellness | 70.5 | - | - | - | ||
| Gain on disposal of investment and investment income | 207.0 | - | - | - | ||
| Gain on valuation of investment in associate before bussiness acquisition | 245.5 | - | - | - | ||
| Gain on bargain purchase | 674.0 | - | - | - | ||
| Gain on sale of investment property | 12.3 | - | - | - | ||
| Compensation fee from termination of sublease agreement | - | - | - | 198.1 | ||
| Other income | 328.9 | 1.2 | 8.4 | 13.5 | ||
| Total income | 2,595.0 | 89.8 | 52.1 | 13.5 | ||
| Costs and Expenses | ||||||
| Business operation costs and expenses | 42.4 | 73.8 | 63.4 | 283.8 | ||
| Cost of sale of real estate | 585.2 | - | - | - | ||
| Cost of rental and rendering of services | 113.0 | - | - | - | ||
| Cost of management of real estate | 17.4 | - | - | - | ||
| Cost of health and wellness | 160.83 | - | - | - | ||
| Distribution costs | 64.6 | - | - | - | ||
| Distribution costs | 64.6 | - | - | - | ||
| Servicing and administrative expenses | 730.3 | 41.5 | 58.1 | 54.7 | ||
| Net loss on investment measured at fair value throught profit or loss | 52.41 | - | - | - | ||
| (Gain)Loss on exchange | 7.8 | - | - | - | ||
| Allowance for expected credit loss (reversal) | 7.8 | - | - | - | ||
| Other expenses | - | - | 56.1 | 75.2 | ||
| Total costs and expenses | 1,774.0 | 115.3 | 144.7 | 475.4 | ||
| Profit (loss) from operations | 821.0 | (25.5) | (92.6) | 288.2 | ||
| Finance costs | (380.9) | (49.0) | 58.5 | 72.7 | ||
| Share of profit(loss) from associates and joint venture accounted for equity method | 6.7 | 6.2 | 50.9 | 30.8 | ||
| Gain on disposal of building and equipment | (35.0) | 298.8 | - | - | ||
| Income tax - income (expense) | (51.0) | - | - | - | ||
| Profit (loss) before income tax expense | 360.9 | 230.5 | 16.8 | - | ||
| (loss) profit for the year from discontinued operation,net of tax | - | (125.6) | 58.1 | - | ||
| Income tax - income (expense) | - | - | - | (23.0) | ||
| Profit(loss) for the period | 360.9 | 104.9 | 74.9 | 368.7 | ||
| Profit(loss) atttributable to: | ||||||
| Owners of the parent | 685.44 | 104.9 | - | - | ||
| Non-controlling interests | (324.5) | - | - | - | ||
| Earnings per Share (Bt.) | 1.66 | 0.59 | (0.12) | 0.65 | ||
| Consolidated Financial Statements | 31-Dec 2023 | 31-Dec 2022 | 31-Dec 2021 | 31-Dec 2020 | ||
| Total Assets | 24,273.1 | 3,291.4 | 4,128.5 | 4,068.3 | ||
| Total Liabilities and Shareholders' Equity | ||||||
| - Total Liabilities | 17,042.8 | 721.0 | 1,511.2 | 1,261.9 | ||
| - Total Shareholders' Equity | 7,230.3 | 2,570.4 | 2,617.3 | 2,806.4 | ||
| - Equity attributable to owners of the parent | 4,393.9 | - | - | - | ||
| - Non-controlling interests | 2,836.4 | - | - | - | ||
| Total Liabilities and Shareholders' Equity | 24,273.1 | 3,291.4 | 4,128.5 | 4,068.3 | ||
| Issued and paid-up share capital (share) | 500,651,065.00 | 345,855,440.00 | ||||
| 2023 31-Dec 2023 |
2022 31-Dec 2022 |
2021 31-Dec 2021 |
2020 31-Dec 2020 |
|||
| Net Earnings to Total Income | -12.5% | 116.8% | -15.9% | 29.2% | ||
| Return on Average Total Assets | -2.4% | 2.8% | -1.0% | 5.5% | ||
| Return on Average Total Shareholders' Equity | -9.3% | 4.0% | -1.6% | 8.1% | ||
| Debt to Equity (times) | 2.35 | 0.58 | 0.45 | |||
| Book Value per Share (Bt.) | 8.78 | 7.43 | 7.57 | 8.11 | ||
quarterly
financials
| Consolidated Financial Statements (Quarterly) | Q1-2023 | Q2-2023 | Q3-2023 | Q4-2023 | Q1-2024 | Q2-2024 | Q3-2024 | % QoQ | % YoY |
| Revenues | |||||||||
| Revenues from business operation | 11.2 | 89.0 | 43.7 | 59.2 | 76.6 | 45.2 | 70.2 | 55.3% | 60.6% |
| Revenues from sale of real estate | - | - | 465.4 | 101.4 | 143.3 | 123.2 | 104.5 | -15.2% | -77.5% |
| Revenues from rental and rendering of services | - | - | 149.5 | 80.6 | 172.2 | 181.8 | 196.2 | 7.9% | 31.3% |
| Revenue from management of real estate | - | - | 30.2 | 26.5 | 27.4 | 29.8 | 24.4 | -18.2% | -19.3% |
| Revenue from health and wellness | - | - | 24.7 | 45.8 | 61.6 | 49.5 | 49.5 | 0.1% | 100.6% |
| Revenue from investments | - | - | - | - | - | - | 0.2 | 0.0% | 0.0% |
| Gain on disposal of investment and investment income | - | - | 25.6 | - | - | - | - | n/a | n/a |
| Gain onvaluation of investment in associate before bussiness acquisition | - | - | 360.3 | (0.1) | - | - | - | n/a | n/a |
| Gain on bargain purchase | - | - | 861.9 | 0.1 | - | - | - | n/a | n/a |
| Gain on sale of investment property | - | - | - | 10.0 | - | - | - | n/a | n/a |
| Other income | - | 0.9 | 28.8 | 301.5 | 67.5 | 72.8 | 213.5 | 193.3% | 641.3% |
| Total income | 11.2 | 89.9 | 1,990.1 | 625.0 | 548.6 | 502.3 | 658.6 | 31.1% | -66.9% |
| Expenses | |||||||||
| Business operation expenses | 12.6 | 17.8 | - | (0.8) | 11.2 | - | - | n/a | n/a |
| Cost of sale of real estate | - | - | 447.9 | 78.4 | 110.2 | 101.0 | 86.4 | -14.5% | -80.7% |
| Cost of rental and rendering of services | - | - | 47.7 | 68.7 | 73.9 | 79.0 | 65.2 | -17.4% | 36.8% |
| Cost of management of real estate | - | - | 6.3 | 11.1 | 9.0 | 9.2 | 9.2 | -0.2% | 45.7% |
| Cost of health and wellness | - | - | 44.2 | 89.3 | 92.7 | 76.6 | 88.9 | 16.0% | 101.0% |
| Distribution costs | - | - | 37.0 | 27.6 | 34.2 | 48.2 | 30.7 | -36.2% | -16.9% |
| Servicing and administrative expenses | 5.7 | 7.7 | 207.5 | 522.2 | 232.1 | 231.8 | 320.3 | 38.2% | 54.4% |
| Net loss on investment measured at fair value throught profit or loss | 0.5 | 1.2 | 183.0 | (132.3) | 33.0 | 32.3 | - | -100.0% | -100.0% |
| Loss on exchange | (3.7) | 11.5 | - | - | - | - | - | n/a | n/a |
| Other Expenses | - | - | - | - | 50.5 | 30.3 | 28.4 | -6.4% | n/a |
| Total costs and expenses | 15.1 | 38.2 | 973.6 | 664.2 | 646.8 | 608.4 | 629.1 | 3.4% | -35.4% |
| Profit (loss) from operations | (3.9) | 51.7 | 1,016.5 | (39.2) | (98.2) | (106.1) | 29.5 | -127.8% | -97.1% |
| Finance costs | (7.0) | (19.9) | (178.6) | (181.5) | (192.6) | (313.7) | (271.5) | -13.5% | 52.0% |
| Expected credit loss | - | - | - | - | - | - | (15.8) | n/a | n/a |
| Share of profit (loss) from associates and joint venture | 1.6 | 15.3 | (16.1) | 5.9 | 47.8 | 9.0 | 2.8 | -68.4% | -117.6% |
| Impairment loss on investments | - | - | - | (35.0) | - | - | - | n/a | n/a |
| Gain on disposal of building and equipment | - | - | - | - | - | - | - | n/a | n/a |
| Income tax expense | - | - | 30.8 | (60.9) | (57.4) | (58.5) | (34.5) | -41.1% | -211.9% |
| Profit (loss) for the period from continuing operations | (9.3) | 47.1 | 852.6 | (310.6) | (300.4) | (469.3) | (289.4) | -38.3% | -133.9% |
| Profit (loss) atttributable to: | |||||||||
| Non-controlling interests | - | - | (142.3) | (182.2) | (163.9) | (21.0) | (51.2) | 144.0% | -64.0% |
| Earnings per Share (Bt.) | (0.03) | 0.14 | 2.41 | (0.31) | (0.27) | (0.90) | (0.48) | -46.7% | -119.9% |
| Consolidated Financial Statements | 31-Mar-23 | 30-Jun-23 | 30-Sep-23 | 31-Dec-23 | 31-Mar-24 | 30-Jun-24 | 30-Sep-24 | % QoQ | % YoY |
| Total Assets | 3,228.0 | 3,713.4 | 23,449.1 | 24,273.1 | 25,464.0 | 25,797.6 | 25,778.1 | -0.1% | 9.9% |
| Total Liabilities and Shareholders' Equity | |||||||||
| - Total Liabilities | 663.0 | 1,150.1 | 15,889.7 | 17,042.8 | 18,075.0 | 18,157.8 | 18,521.9 | 2.0% | 16.6% |
| - Total Shareholders' Equity | |||||||||
| - Equity attributable to owners of the parent | 2,565.0 | 2,563.3 | 4,539.4 | 4,393.9 | 4,714.0 | 5,015.1 | 4,625.9 | -7.8% | 1.9% |
| - Equity attributable to owners of the parent | - | - | 3,020.0 | 2,836.4 | 2,675.0 | 2,624.7 | 2,630.3 | 0.2% | -12.9% |
| Total Liabilities and Shareholders' Equity | 3,228.0 | 3,713.4 | 23,449.1 | 24,273.1 | 25,464.0 | 25,797.6 | 25,778.1 | -0.1% | 9.9% |
| Issued and paid-up share capital (share) | 345,855,440 | ||||||||
| Key Ratios | Q1-2023 | Q2-2023 | Q3-2023 | Q4-2023 | Q1-2024 | Q2-2024 | Q3-2024 | % QoQ | % YoY |
| Net Earnings to Total Income | -65.6% | 52.4% | 47.4% | -12.5% | -24.9% | -89.2% | -36.2% | -59.5% | -176.3% |
| Return on Average Total Assets | -1.2% | 1.8% | 1.2% | -2.4% | -0.5% | -1.7% | -0.9% | -47.2% | -177.5% |
| Return on Average Total Shareholders' Equity | -1.5% | 2.5% | 1.7% | -9.3% | -7.9% | -24.3% | -13.4% | -45.1% | -905.1% |
| Debt to Equity (times) | 0.26 | 0.45 | 0.45 | 2.35 | 3.83 | 3.62 | 4.00 | 10.6% | 792.4% |
| Book Value per Share (Bt.) | 7.42 | 7.41 | 7.41 | 8.78 | 9.42 | 10.02 | 9.24 | -7.8% | 24.7% |
performance indicators
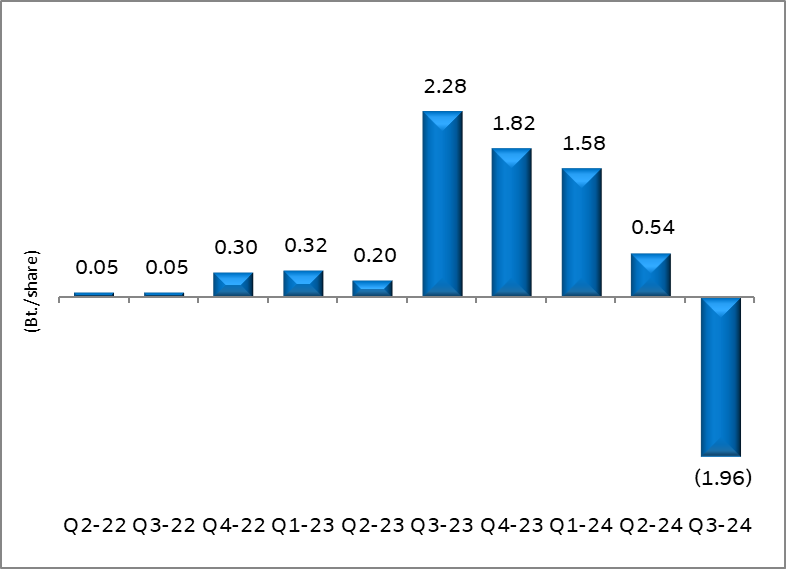
EPS (ROLLING 12 MONTHS)
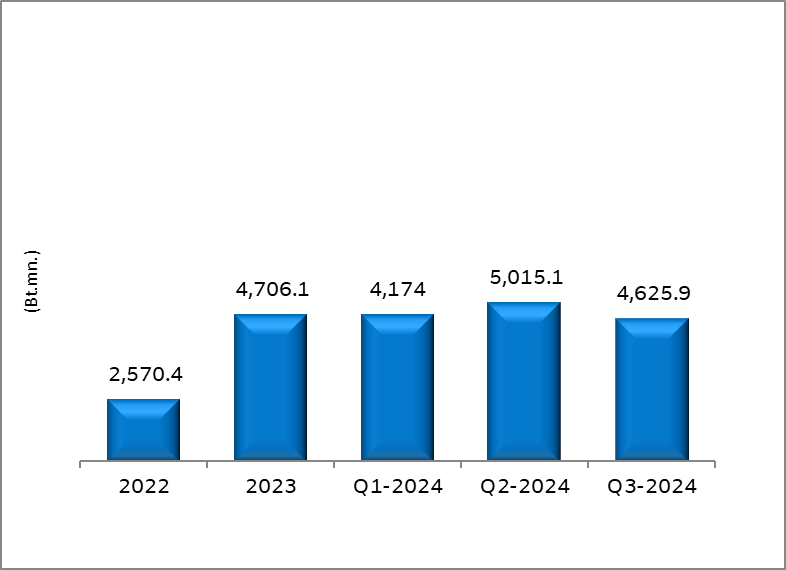
TOTAL SHAREHOLDERS’ EQUITY
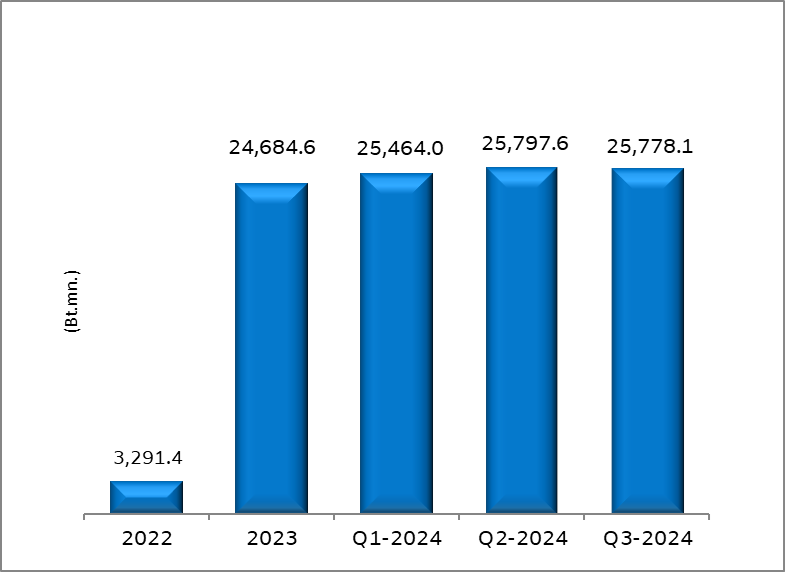
TOTAL ASSETS
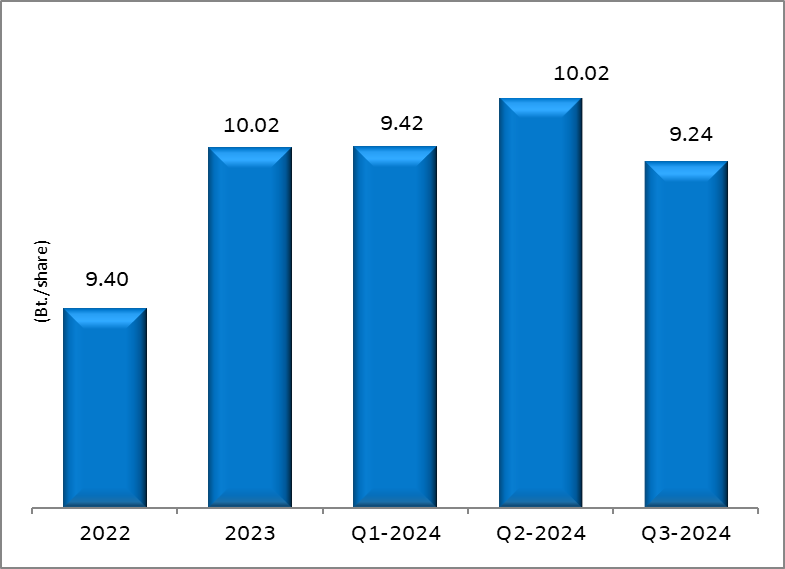
BOOK VALUE PER SHARE
dividends
| Period | Amount | XD Date | Payment Date |
| 1-Jan-22 to 31-Dec-22 | Bt 0.20 | 9-May-23 | 24-May-23 |
| 1-Jan-21 to 31-Dec-21 | Bt 0.50 | 11-May-22 | 27-May-22 |
| 1-Jan-20 to 31-Dec-20 | Bt 0.15 | 11-May-21 | 27-May-21 |
| 1-Jan-20 to 31-Dec-20 | Bt 0.35 | 8-Mar-21 | 22-Mar-21 |
| 1-Jan-20 to 30-Jun-20 | Bt 0.15 | 1-Oct-20 | 14-Oct-20 |
| 1-Jan-18 to 31-Dec-18 | Bt 0.15 | 3-May-19 | 21-May-19 |
| 1-Jan-17 to 31-Dec-17 | Bt 0.15 | 7-May-18 | 24-May-18 |
| 1-Jan-16 to 31-Dec-16 | Bt 0.10 | 3-May-17 | 24-May-17 |
| 1-Jan-15 to 31-Dec-15 | Bt 0.10 | 3-May-16 | 19-May-16 |
| 1-Jan-15 to 30-Jun-15 | Bt 0.20 | 14-Oct-15 | 27-Oct-15 |
| 1-Jan-14 to 31-Dec-14 | Bt 0.10 | 8-May-15 | 25-May-15 |
- Invitation to shareholders to propose the Annual General Shareholders’ Meeting Agenda and Director Nominee in advance
>> For details, Click here(Thai only)